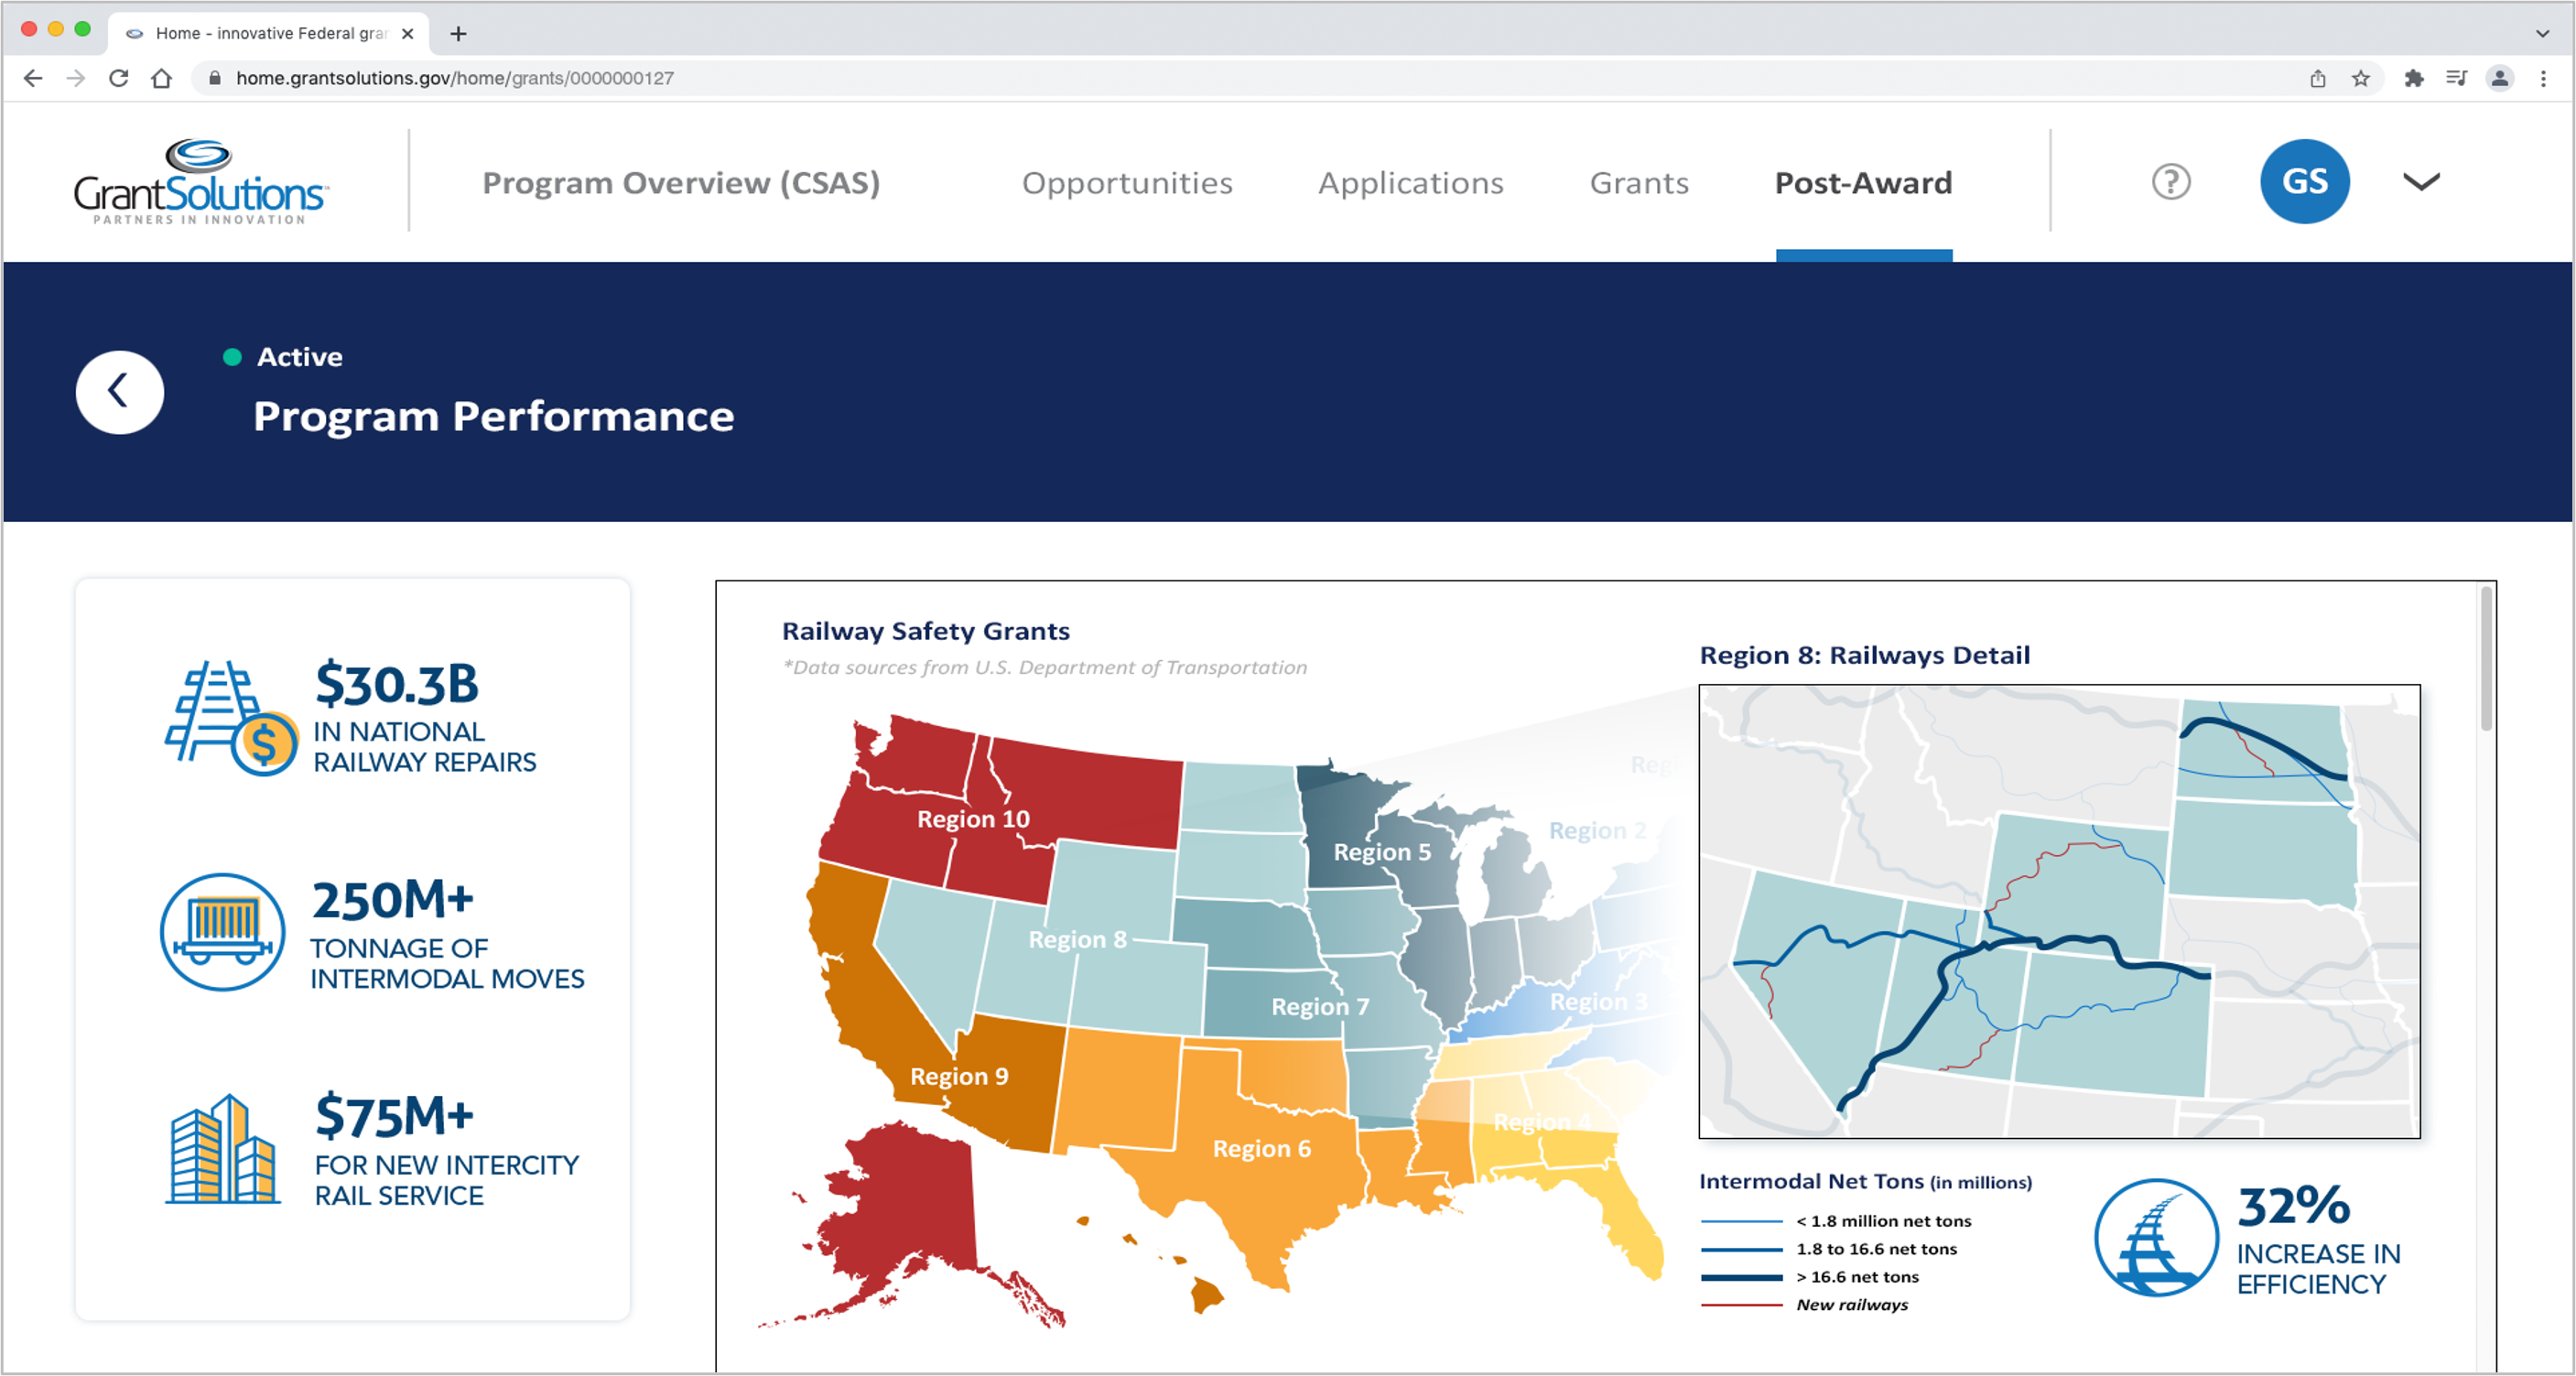
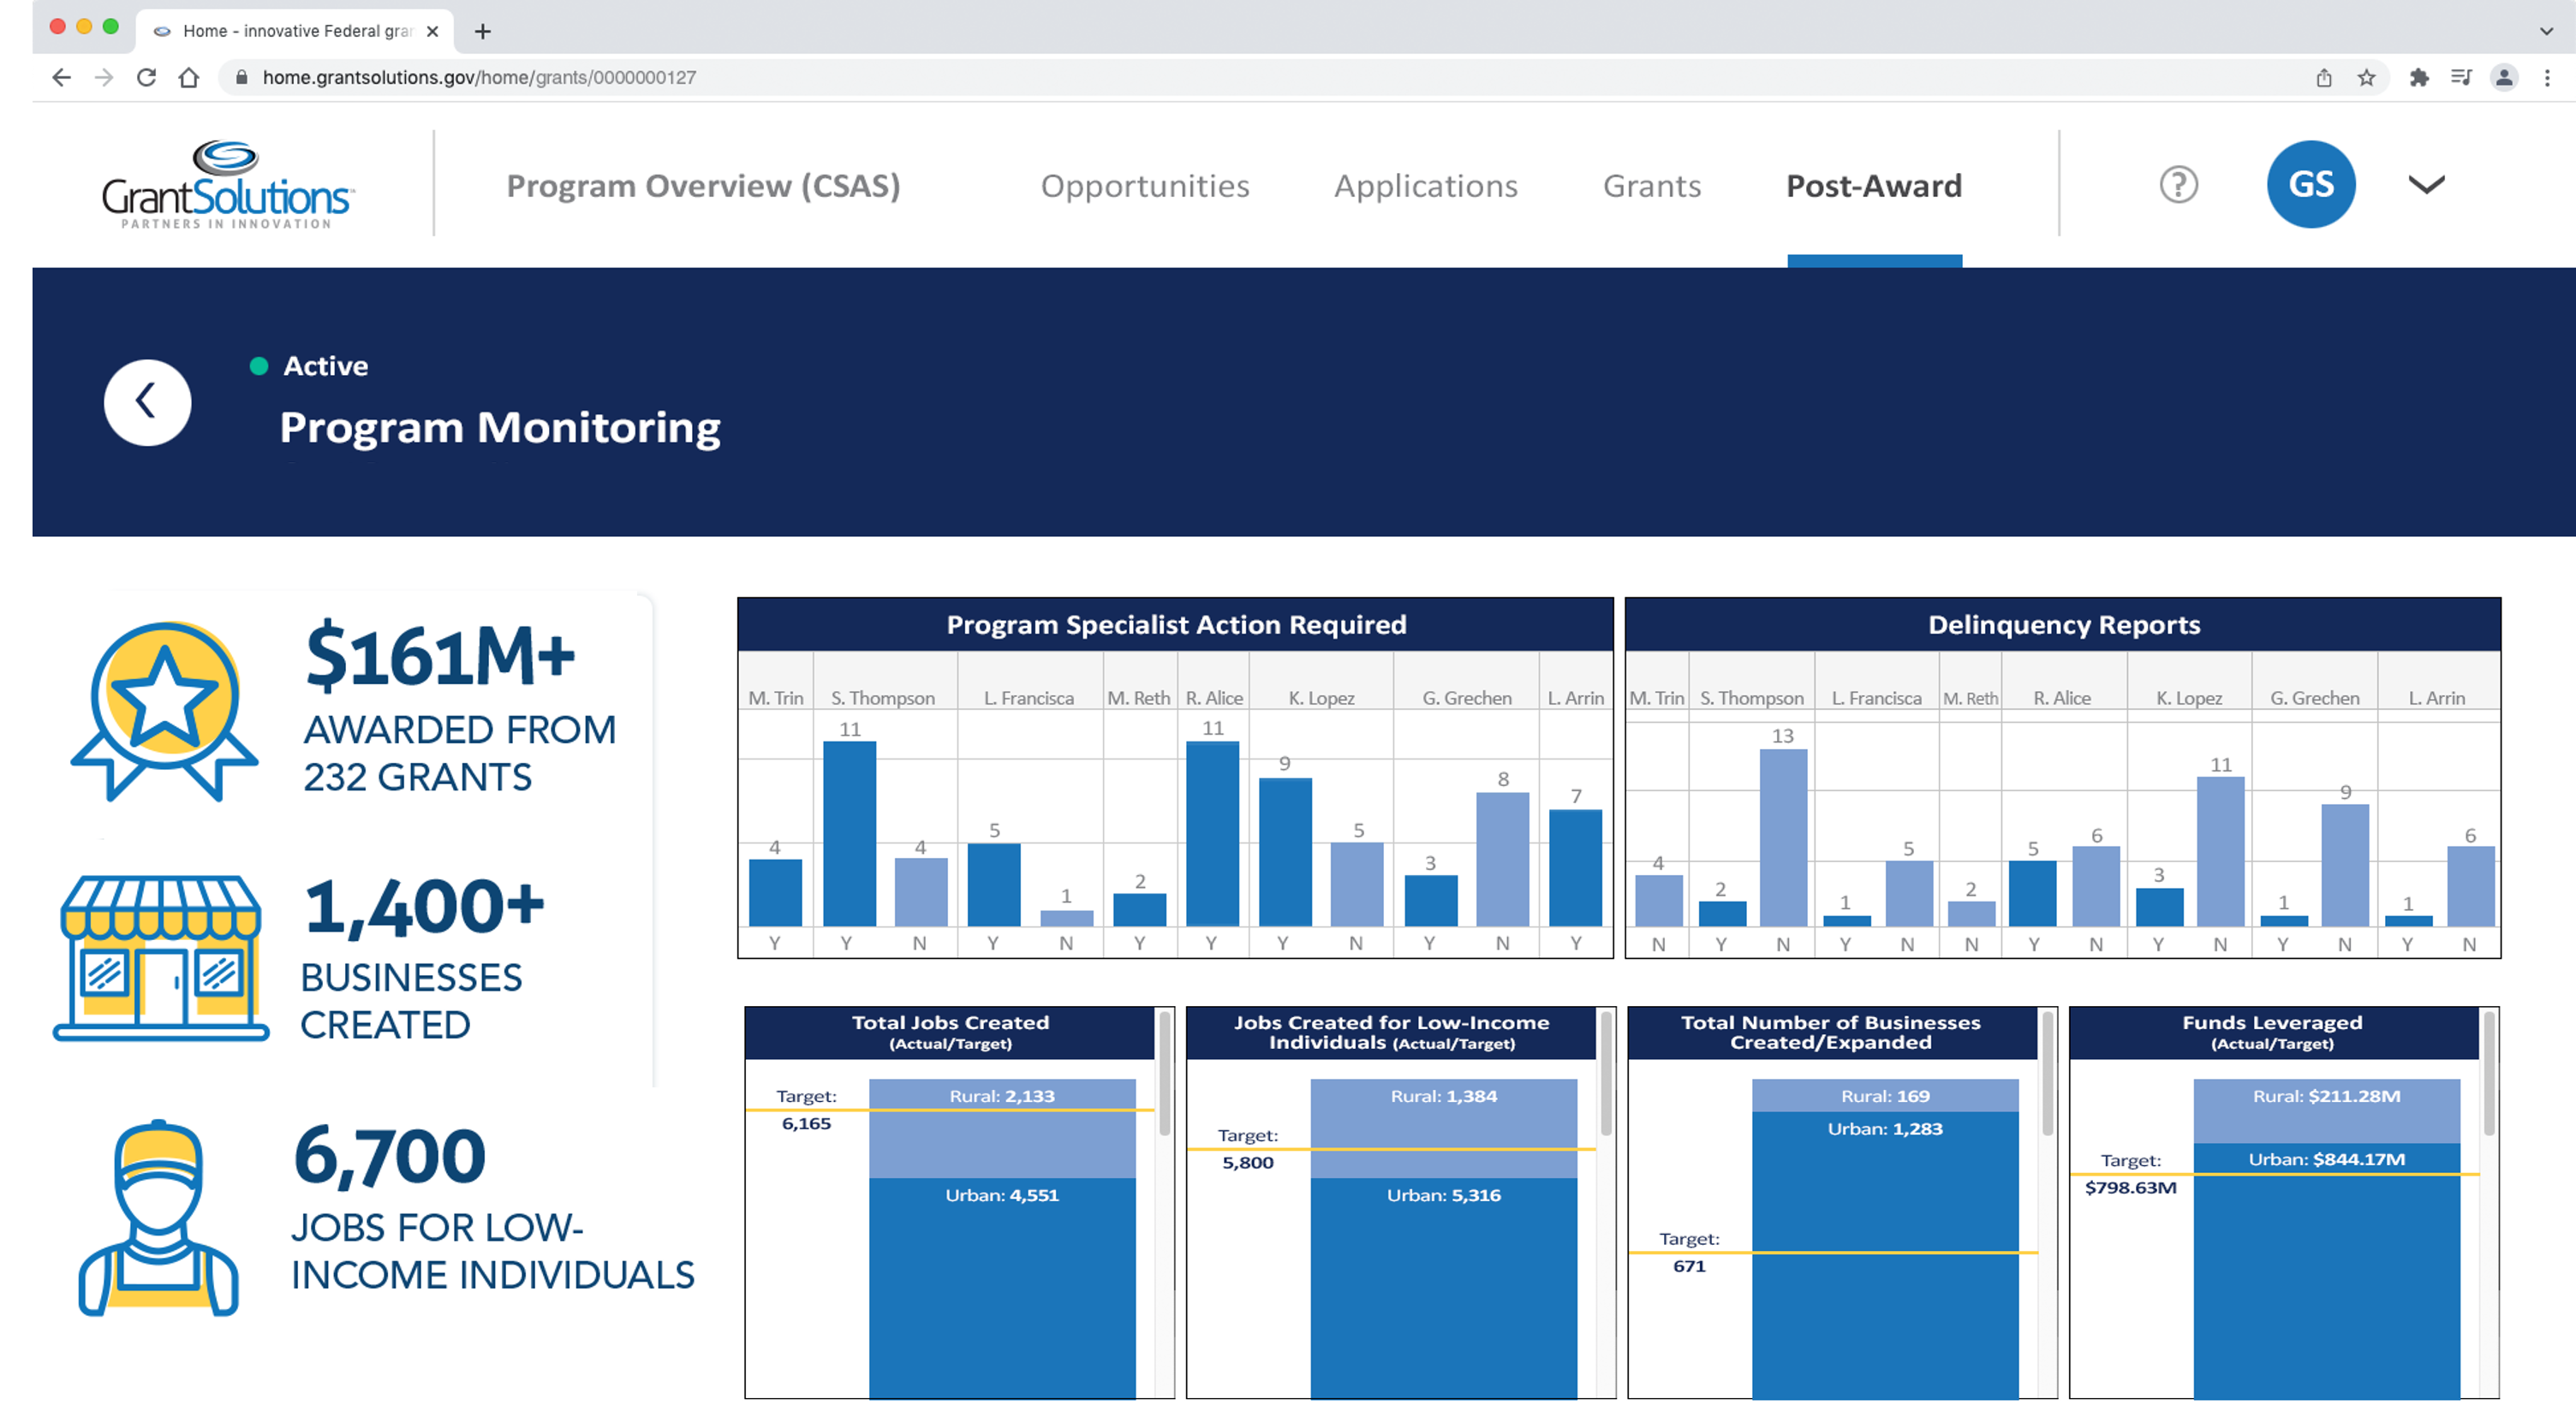
Develops meaningful analytics through Business Intelligence (BI) dashboards highlighting outcomes and impacts for the Program office. Dashboards enable users to view information at an executive level and quickly drill down into further detail. Helping agencies better understand their grants operations through data-driven decisions and the outcomes generated by their grant investments.

100+ Standard Dashboards
BI Dashboards take large quantities of data generated from the grants lifecycle and present it in a meaningful and actionable way. Leveraging the data to provide users with interactive visualizations on a holistic and as-needed basis, displaying a detailed view of program performance.
- A wide array of options are available to populate the necessary data by clicking and filtering so information is available to view in many possible ways.
- Visual representations of data are readily available through interactive maps and charts.
- Data is refreshed hourly in all dashboards.
Custom Performance Data Analytics and Reports
GrantSolutions data visualization and analytics services help ensure the accountability and effectiveness of the grantmaking process.
- Share how outcomes generated by grant investments impact communities through actionable data.
- Visualize key performance indicators to quickly analyze Program and Recipient performance.
- Program and Recipient scorecards convert data inputs into Program outcomes.
- Leverage and incorporate external data sets with performance data to highlight Program demographics.
- Include data provided from external systems. Or transform external data into custom data visualizations, available to share on your website.


